Debugging Sites Authorization Required Error!
Force.com site redirects to the “Authorization Required” page in case something goes wrong behind the scenes, for example:
The site’s public access settings or user profile doesn’t have access to a page, Object, field, etc used in the Visualforce page/controller.
In the case of Apex Exceptions like LimitException.
The “Unauthorized” page makes sense in case of a missing access problem. But in the case of “Exceptions”, ideally, the redirect should be the “Exception” page.
The end user obviously can’t figure out anything by seeing the page. So how should developers debug this problem?
Debugging the cause of the Authorization required error
Test Fixture
To easily reproduce this problem for all. I just created a super simple VF page. This VF page has an Authorization required error because it tried to do “DML” inside the controller’s constructor. Details of both the page and controller are available in code snippets below.
VF Page
<apex:page controller="MyPageController">
    <apex:outputLabel for="contactName" value="Created Contact :"></apex:outputLabel>
    <apex:outputField id="contactName" value="{!contact.Name}"/>
</apex:page>
Controller
public class MyPageController {
    public  Contact contact {get;set;}

    public MyPageController () {
     // We are not allowed to do DML in constructor.
  // So this should reproduce the Autorization error on sites
  // pretty easily
        contact = new Contact(FirstName='Failing', LastName ='Contact');
        insert contact;
    }

}
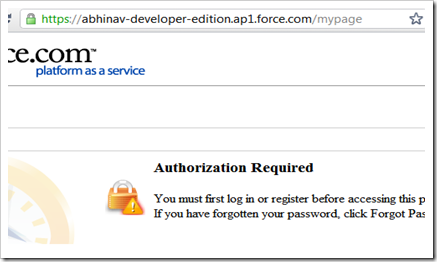
On executing this page with sites, you will get an “Authorization Required” error, as shown:
Next, we will see approaches to debug the cause of this issue.
Debug Approach 1:
The first approach to debug this problem would be to
Enable debugging for “Sites User”, under Setup > Monitoring > Debug Logs.
Refresh the page failing for the “Authorization” error.
Check what comes in debug logs.
The above approach will work most of the time and will let developers know why the “Authorization Required” page is shown. In our case, debug logs clearly say “DML currently not allowed”, as shown in the screenshot below:
But sometimes on an “Authorization” error, no debug logs are generated even if you have enabled debug logging for the user. In that case, jump to Approach 2.
Debug Approach 2:
Log in to your Salesforce.org. Make sure you have turned on “Development Mode” under “Setup > Personal Information > Development Mode”. Try running the same Visualforce page without the site's domain, i.e. execute the page just like any other Visualforce page, for example.
As development mode is on, one should see the error caused on the page itself. As shown in the screenshot below:
Still, if you can’t see any error on the Visualforce page, jump to Approach 3 described below:
Debug Approach 3:
In this approach, we will create another sites page that calls the failing sites page via Apex API, i.e.
“Page.mypage.getContent().toString()”Let's call that site's Visualforce page “Error Finder”. Following is the visual force + apex code for this new page.
Visualforce Page—ErrorFinder
<apex:page controller="ErrorFinderController" action="{!fetchFailingPage}" showHeader="false" sidebar="false" > <apex:outputText id="failingPageResponse" escape="false" value="{!failingPageResponse}" /> </apex:page>
Apex Controller – ErrorFinderController
public class ErrorFinderController {
    public String failingPageResponse { get; set; }

    public void fetchFailingPage() {
       try {
           // Make a call to failing sites page here
           failingPageResponse = Page.mypage.getContent().toString();
       } catch (Exception e) {
           failingPageResponse = e.getTypeName() + ' : ' + e.getMessage() ;
       }
    }
}
On executing this page after connecting with sites, you will see why the site page “mypage” was showing an Authorization required error. Here is the screenshot of the errorfinder sites page:
Moreover, you can also try “Debug Approach 2” described above, i.e. looking into debug logs at “Setup > Monitoring > Debug Logs” for the site's user. You will get better details of the error if debug logs are available for the failing “mypage”.
More ideas/ways you know?
Please share any thoughts or better ideas to know the cause of such site page errors.
Let’s Talk
Drop a note below to move forward with the conversation 👇🏻


